Overview
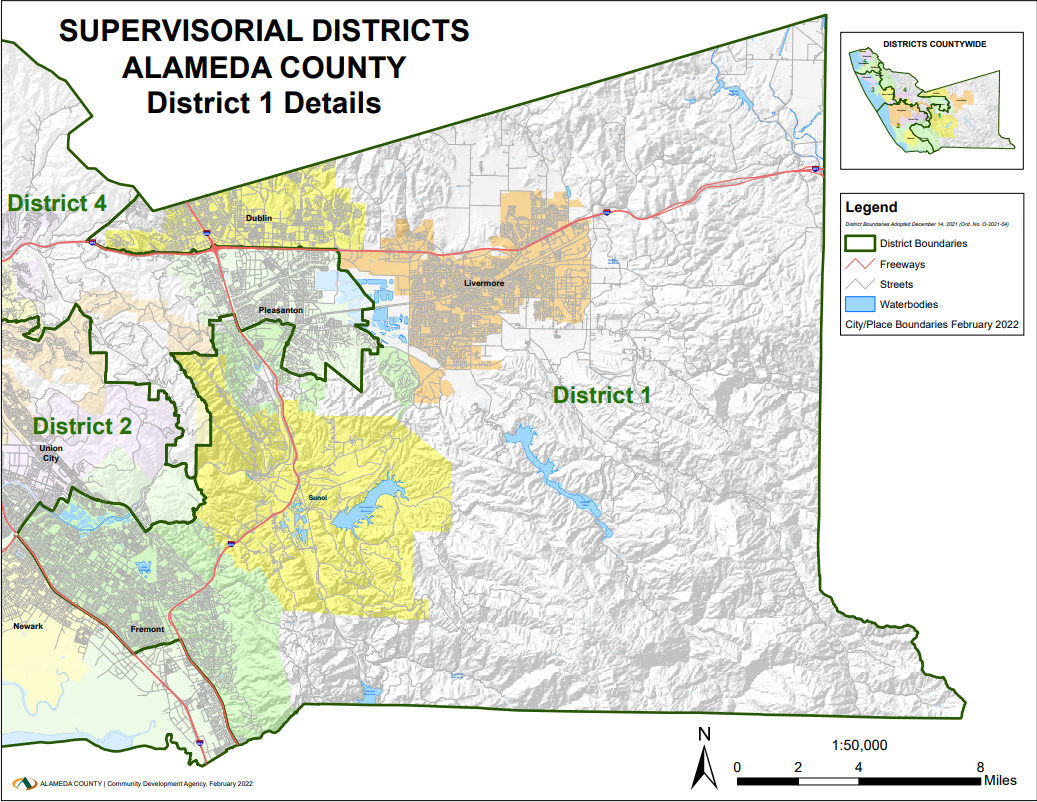
This dashboard reports how District 1 cities, including Pleasanton, Dublin, Livermore, and Fremont, are responding to climate change and which of these cities are leading and lagging in climate action. While climate change is a heavily explored topic on the state and national level, there is not much information on comparing climate action between District 1 cities. To answer this question, data for 5 metrics, GHG emissions, CAP score, heat pump adoption, EV infrastructure progress, and tree canopy coverage, across 3 categories, policy strength, implementation progress, and outcomes, were pulled from various datasets. Based on this data, a climate action index was formulated to compare rankings and cities across the metrics. This dashboard is intended as a public civic transparency resource for residents, policymakers, and District 1 staff.

Category 1: Policy Strength
CAP Score
This evaluates each city's Climate Action Plan (CAP) based on its quality and implementation. Cities are scored on a 1–5 rubric considering the presence of measurable targets, implementation tracking, and evidence of completed actions.

Category 2: Implementation Progress
Heat Pump Adoption
EV Infrastructure Progress
Tree Canopy Coverage
This evaluates how effectively each city is putting climate action into practice using three metrics: heat pump adoption per 10,000 residents, EV infrastructure progress toward recommended 2030 goals (%), and tree canopy coverage (%). Together, these metrics measure investments in building electrification, transportation, and urban greening.

Category 3: Outcomes
GHG Emissions
This evaluates each city's progress in reducing emissions by comparing its current reduction from its baseline to the expected progress needed to reach its 2030 Climate Action Plan goal. Cities are also compared against California's benchmark of 6.0 metric tons of CO₂e per capita

Normalization
The metrics are normalized using methods appropriate to each dataset: GHG reduction and EV infrastructure are measured as progress toward each city's target, Climate Action Plan scores are normalized with the formula (score − 1) / 4, and tree canopy coverage and heat pump adoption are normalized relative to the other cities. The normalized scores are then ranked independently to produce the final comparisons. The cities are then categorized into "Leading," "Moderate," and "Lagging," based on their average rank.
| Pleasanton |
|
| Livermore |
|
| Dublin |
|
| Fremont |
|