Performance Heatmap
The heatmap below shows the performance of each District 1 city across the five metrics. The color coding indicates how well each city is performing in each metric, with green representing strong performance, yellow indicating moderate performance, and red signifying areas where improvement is needed. Scores range from 0 (lowest performing) to 1 (highest performing) within this dataset.
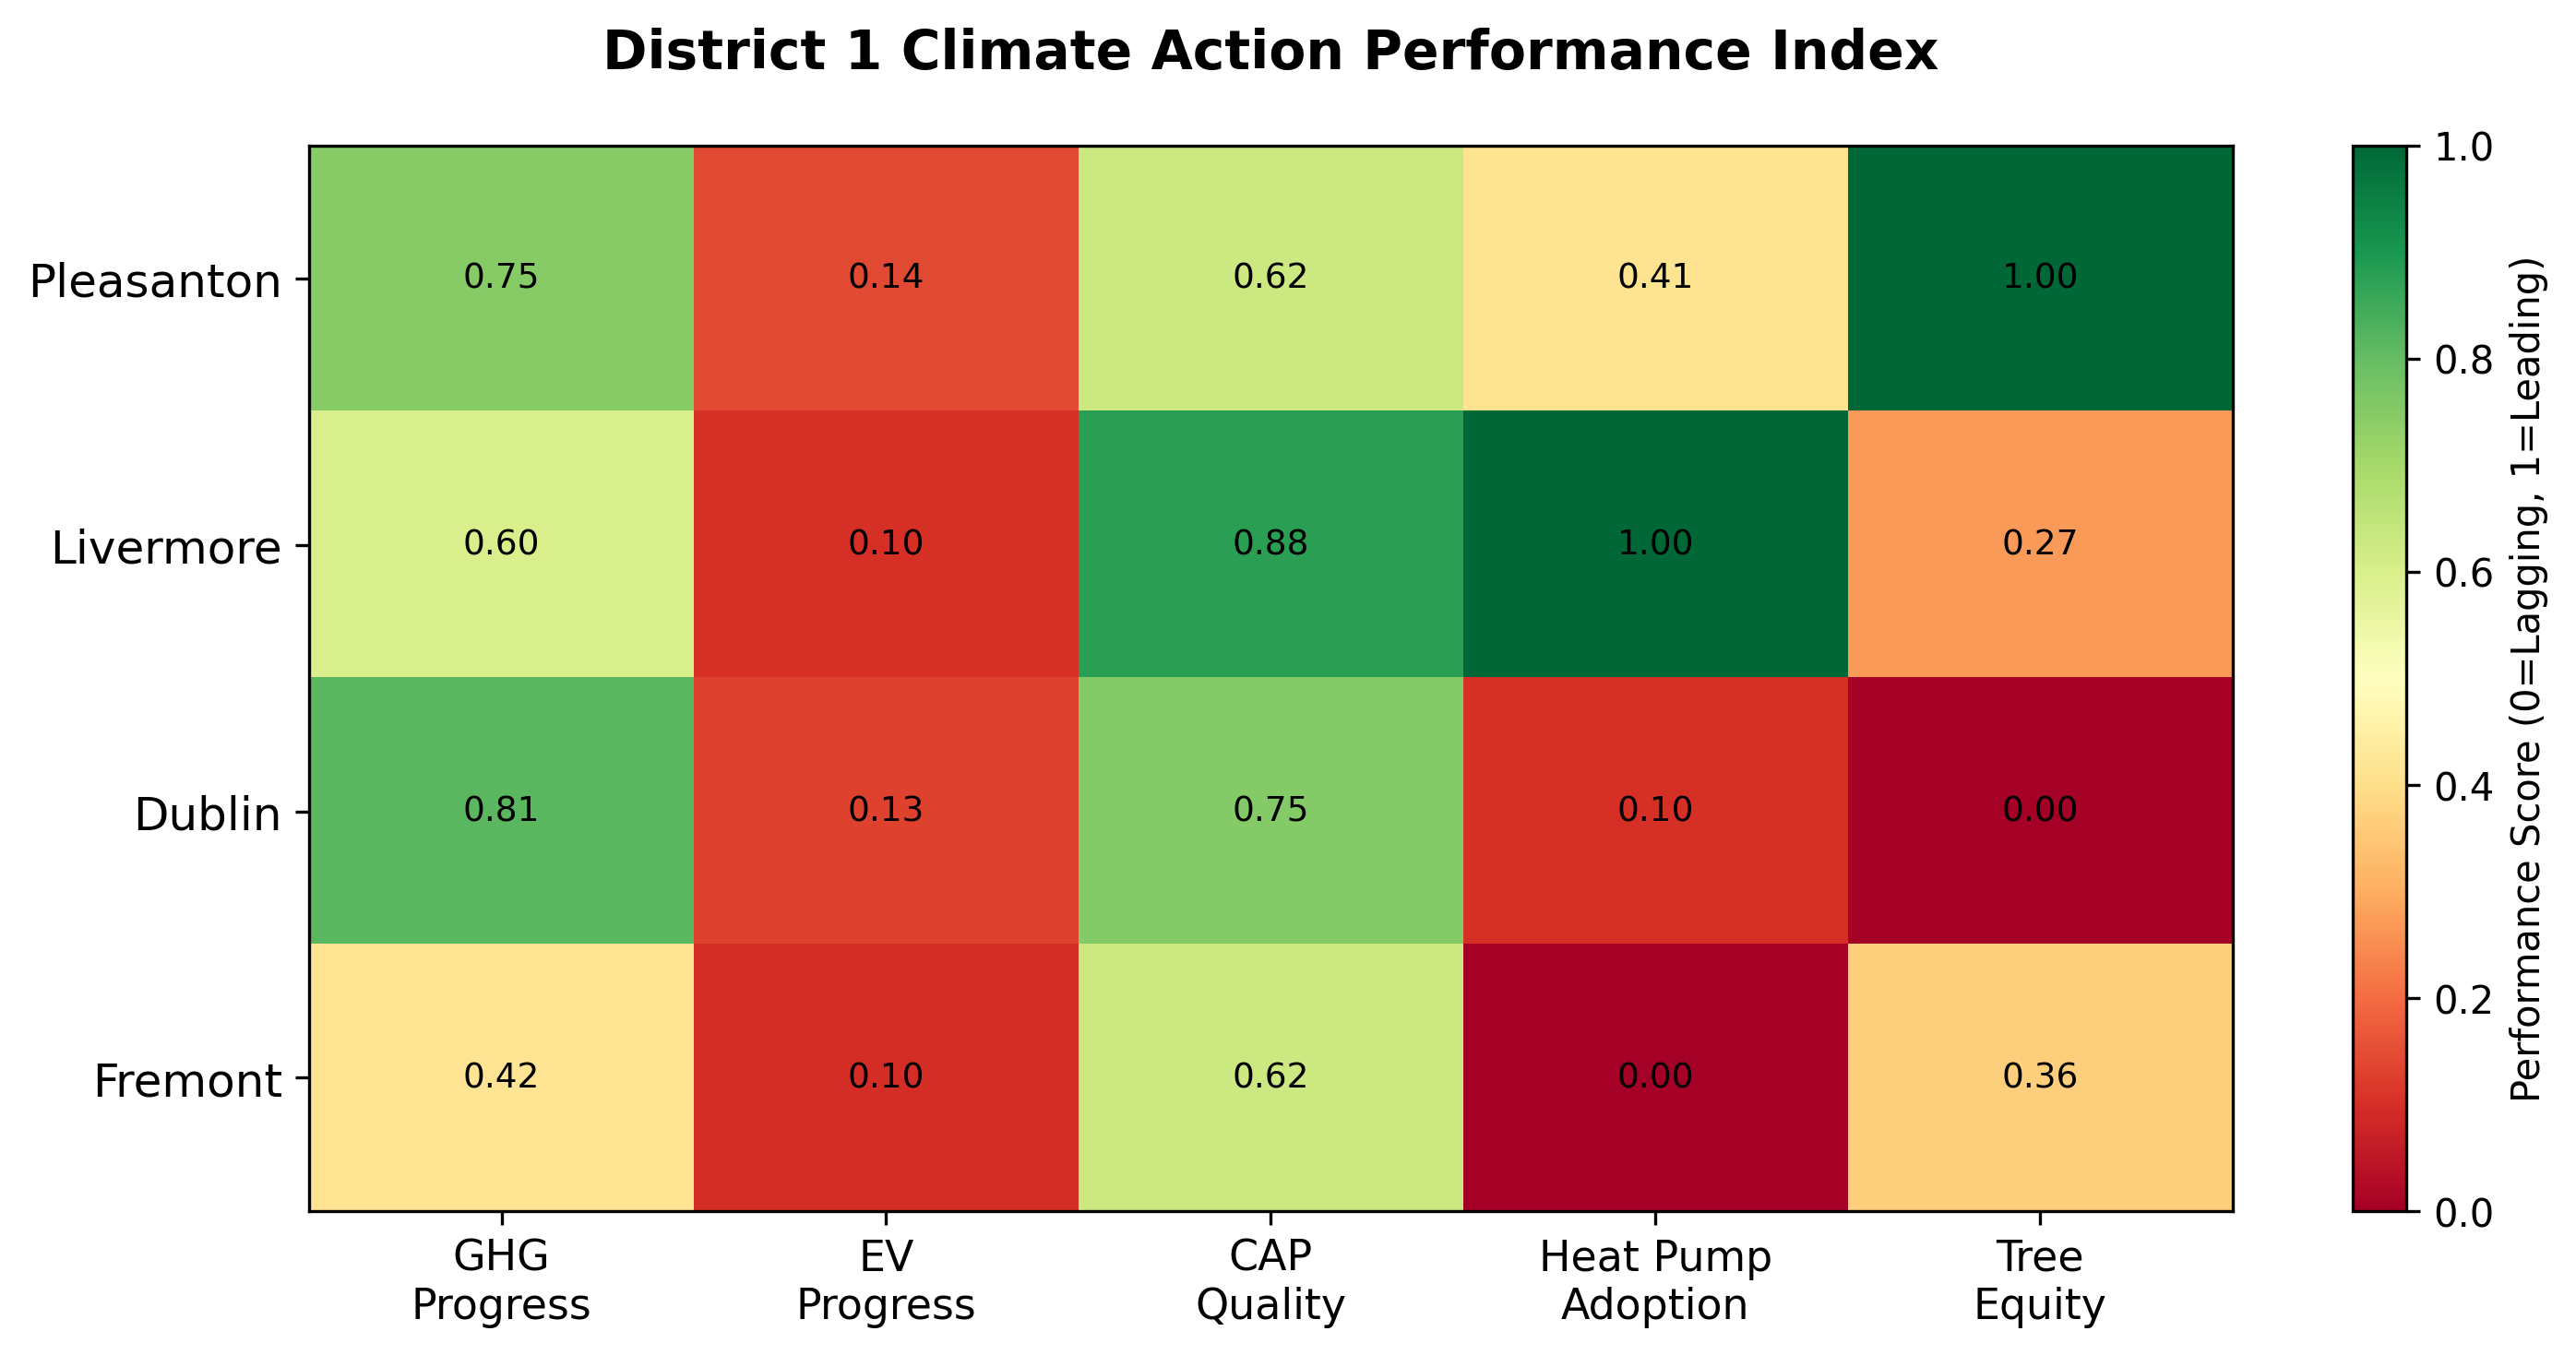
Pleasanton ranks as leading, driven by its strong performance in tree canopy coverage and heat pump adoption. Livermore and Dublin both rank moderate, with Livermore performing stronger on CAP quality and heat pump adoption while Dublin performs stronger on GHG progress. Fremont ranks lagging, with consistently low performance across all five metrics. The performance heatmap reveals some interesting findings about District 1 cities. First, while Pleasanton leads overall, it is also the only city above the 6.0 MT per capita GHG benchmark, meaning that it could be lagging in other metrics not mentioned in this paper or its implementation has not been translated into emission reduction. Livermore has the highest CAP score and quality but ranks second to last on GHG reduction progress. Lastly, all four cities rank below their suggested EV infrastructure benchmarks.
Outcomes
GHG Emissions Analysis
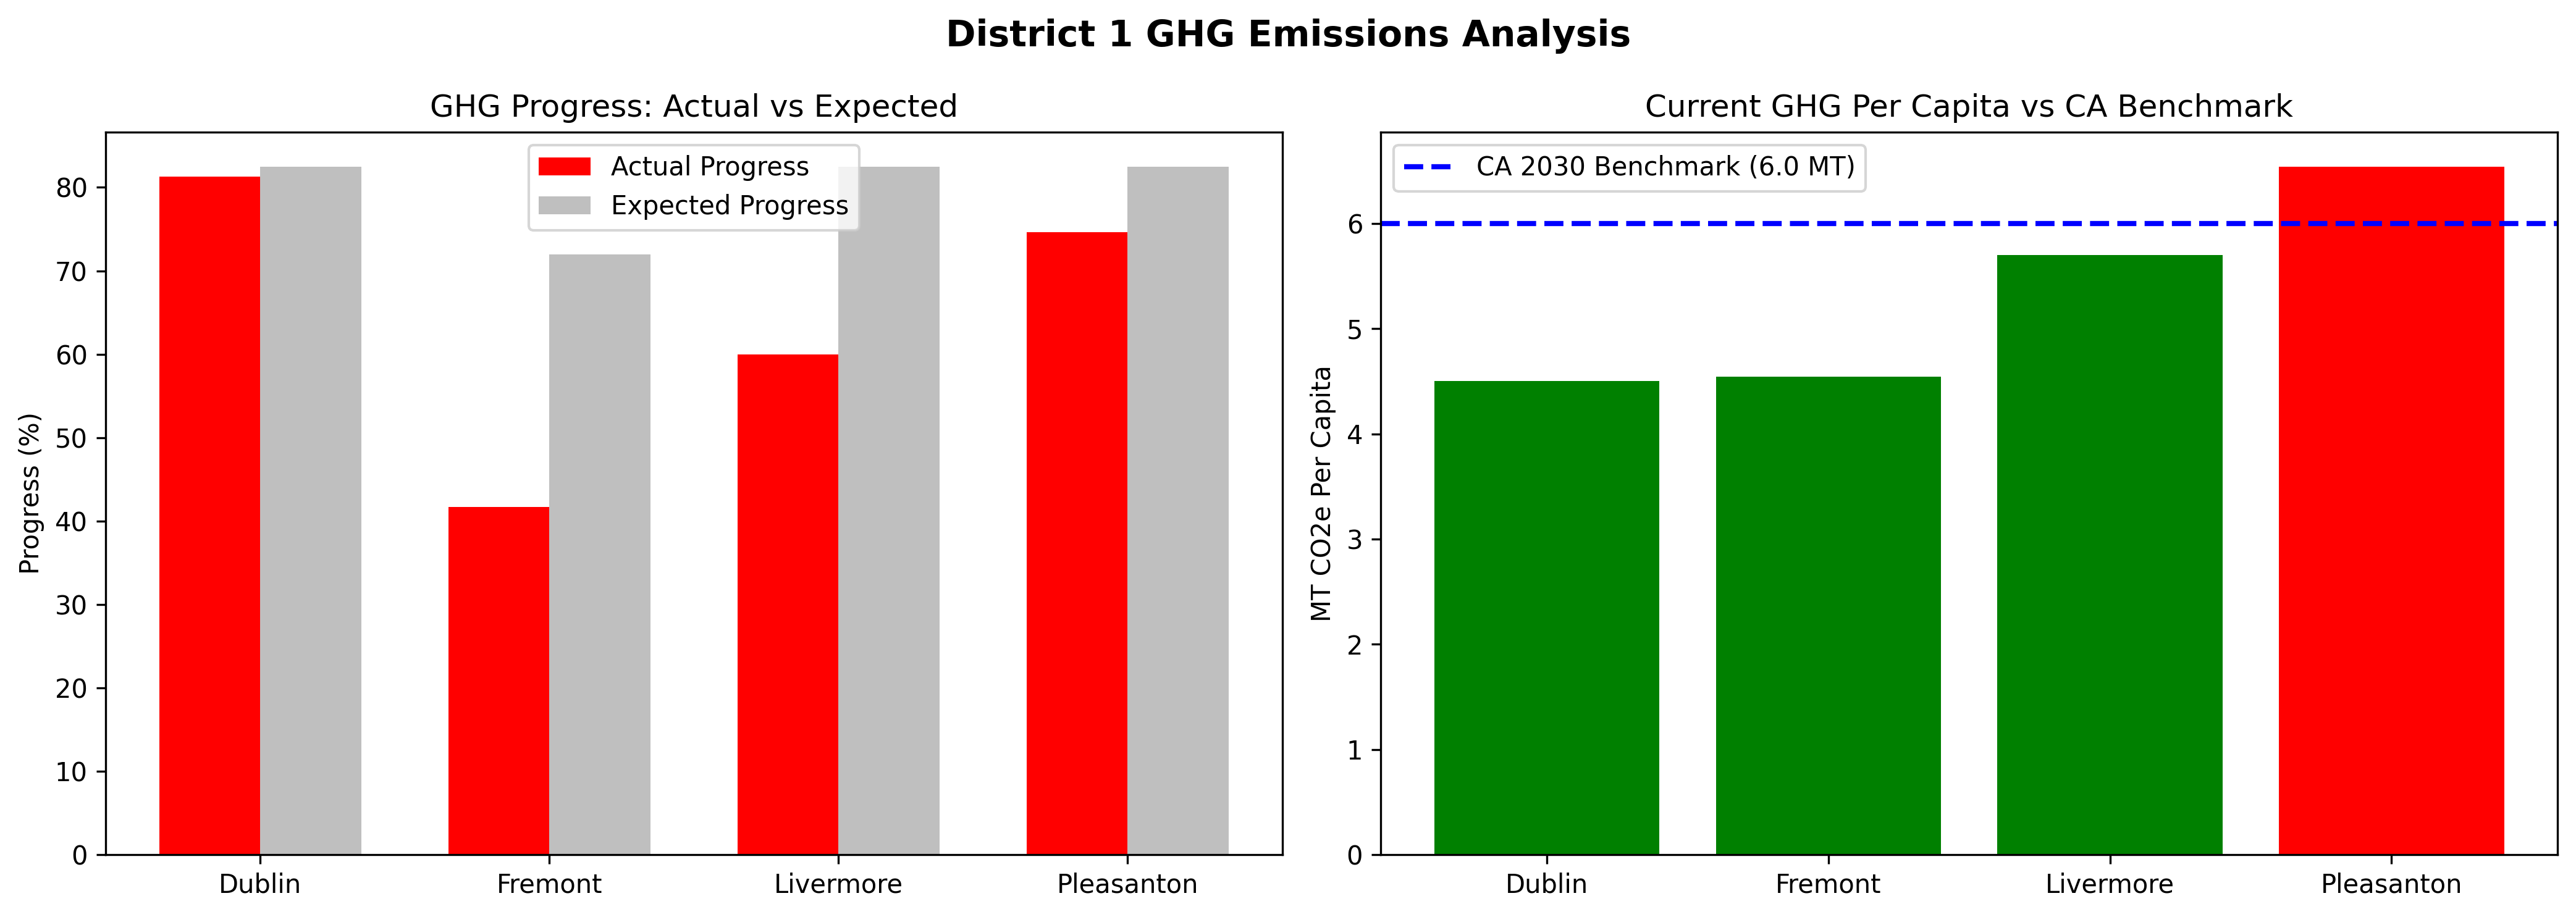
Dublin leads in progression, having achieved 81.32% of its goal already, while the expectation is 82.5%, making it very likely the city will meet its goal soon. Pleasanton ranks second at 74.65%, Livermore follows at 59.94%, and Fremont ranks last at 41.71%. Regarding the California statewide benchmark of 6.0 MT CO₂e per capita, three of four cities currently fall below this threshold. Pleasanton is the only city that falls above it at 6.54 MT CO₂e, meaning that despite ranking first overall in the given metrics, there could be other confounding variables affecting Pleasanton’s high emissions, such as vehicle use or solar panel usage.
Implementation Progress
Heat Pump Adoption Analysis
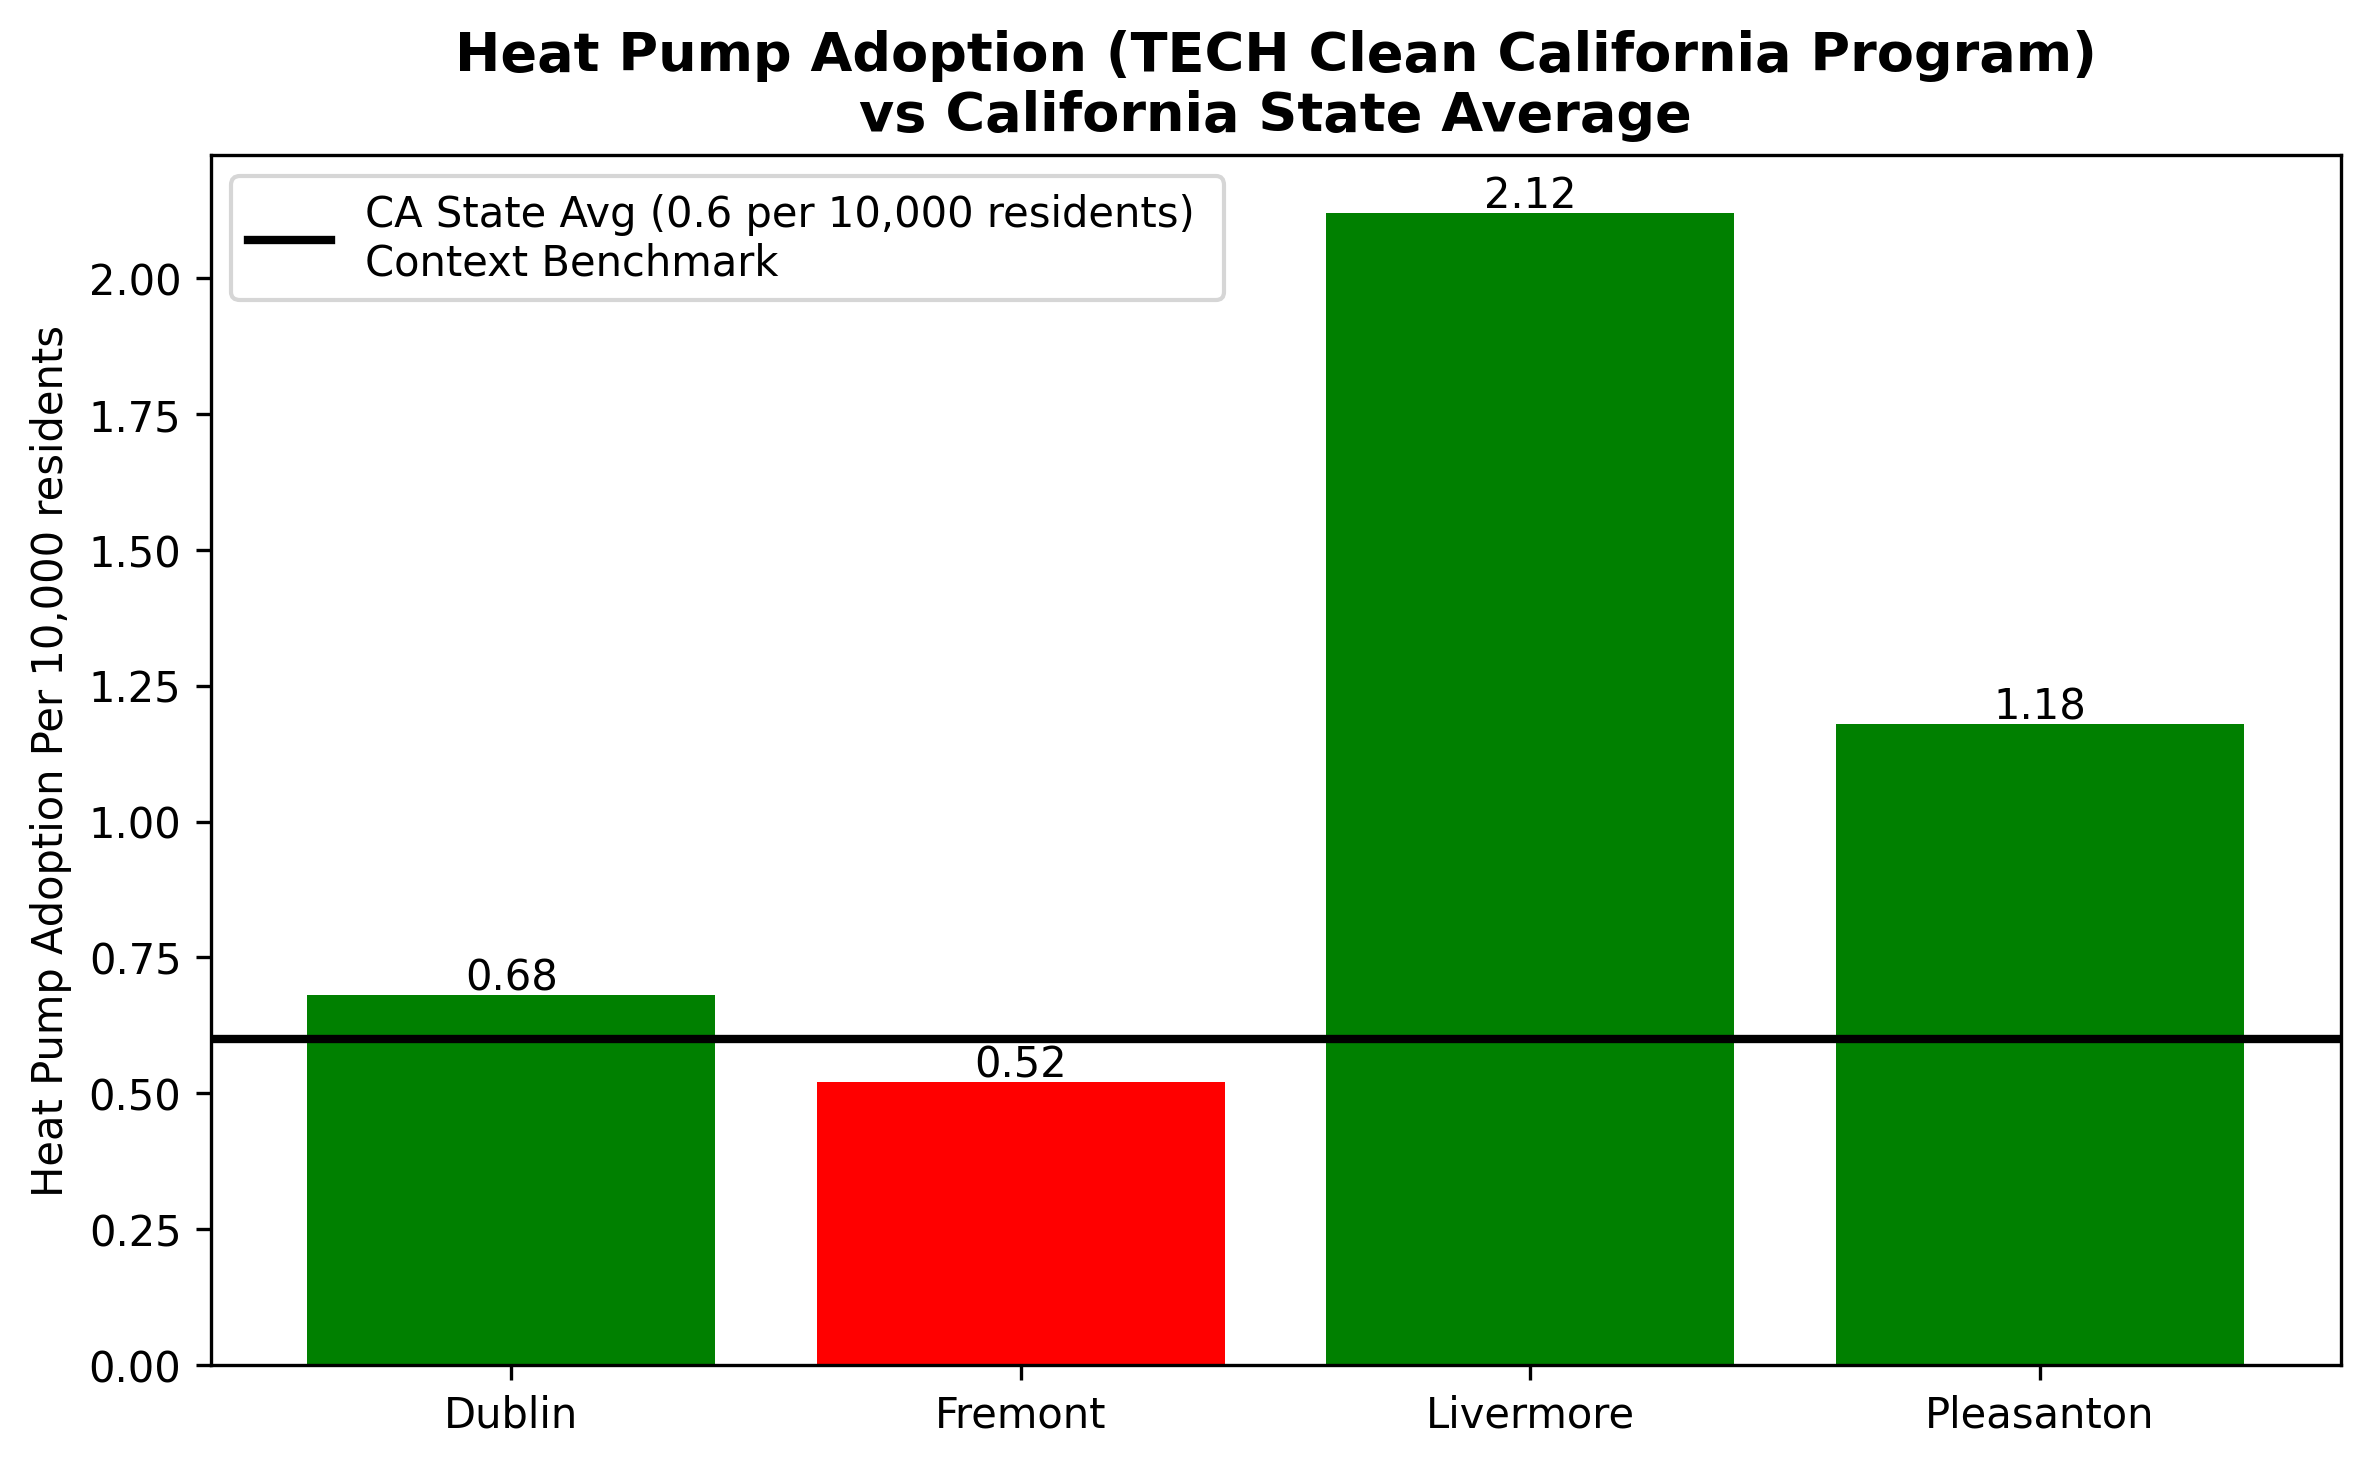
Livermore leads significantly at 2.12 installations per 10,000 residents. Dublin and Pleasanton follow with 0.68 installations and 1.18 installations per 10,000 residents. While Fremont, with 0.52 installations per 10,000 residents, is the only city that falls below the state average of 0.6 installations per 10,000 residents. Compared to other metrics, this is a positive finding since most cities do have installations above the state average. However, it should be noted that this only contains data from installations that received incentives through the TECH California program and may not reflect the total adoption rate.
EV Infrastructure Progress
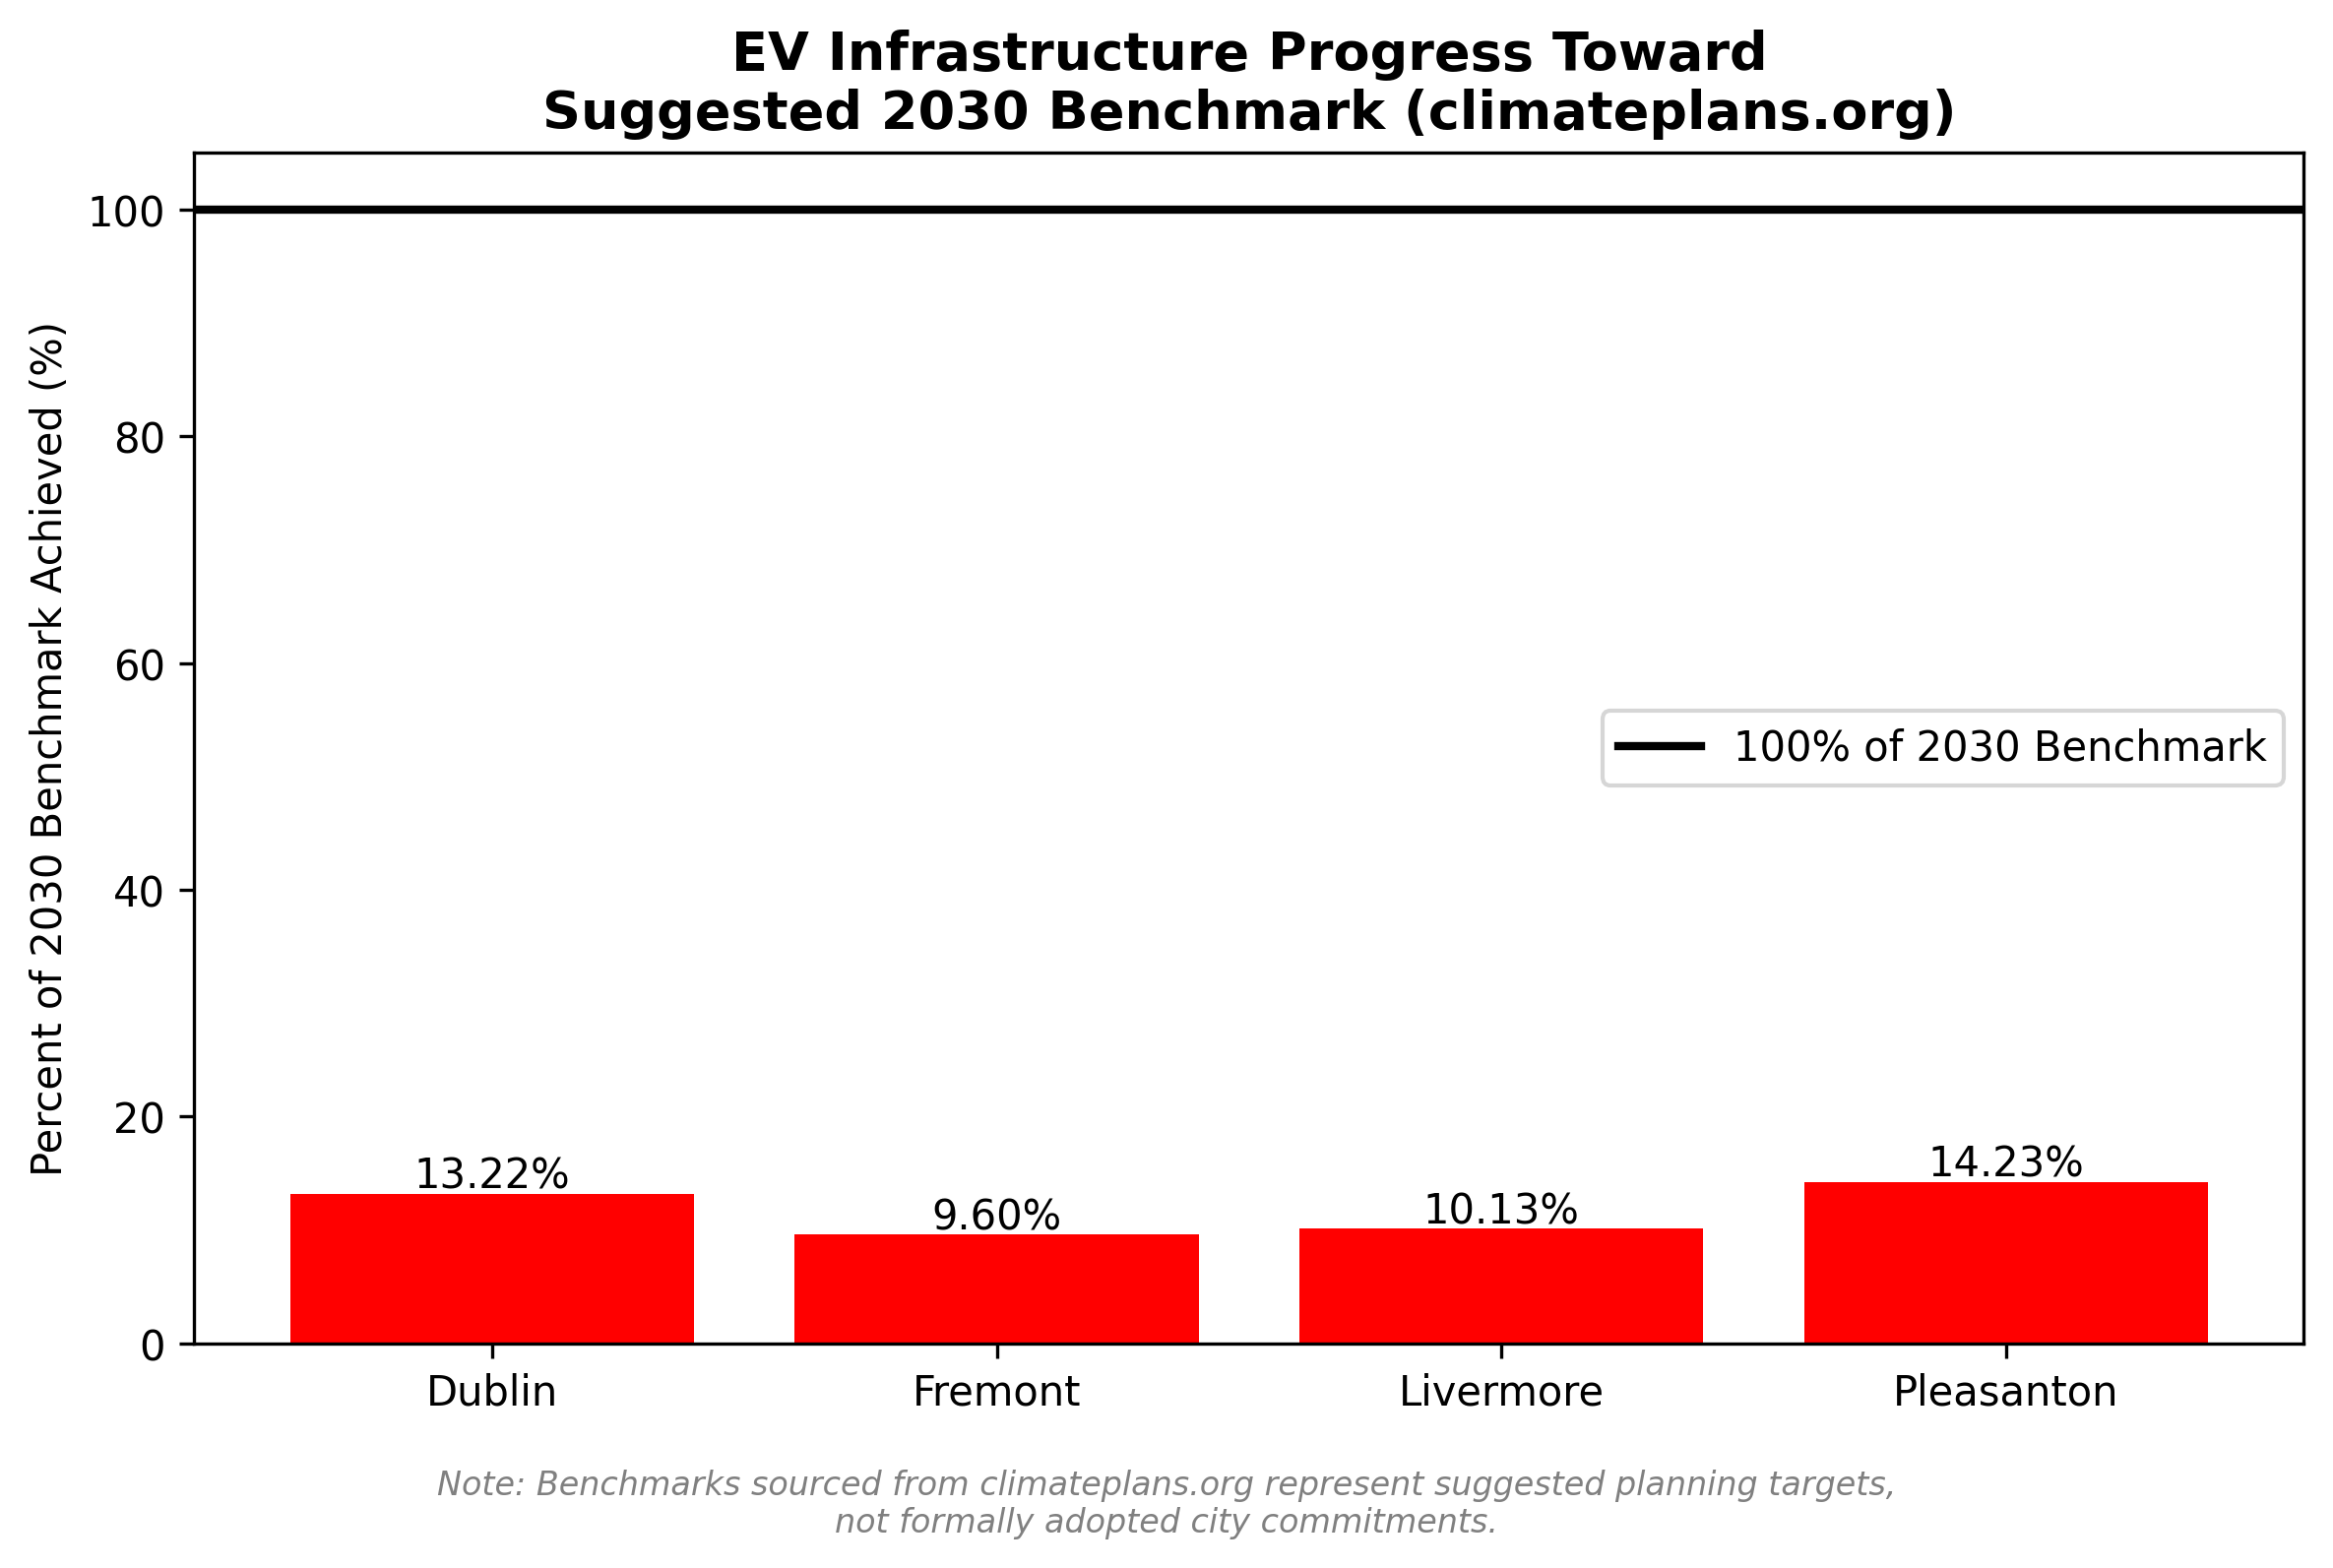
From the data, all four District 1 cities are shown to be severely behind the suggested 2030 benchmark, which shows the most consistent underperformance out of all metrics. These 2030 benchmarks were calculated based on California's goal to hit 1 million charging stations statewide. Pleasanton leads with the most progress at 14.23%, Dublin following closely behind at 13.22%, Livermore with 10.13%, and Fremont with the least progress at 9.60%. Because all cities are severely behind on all targets, it raises the question of whether these benchmarks were aspirational at the time or whether investment in EV infrastructure has become insufficient.
Tree Canopy Coverage
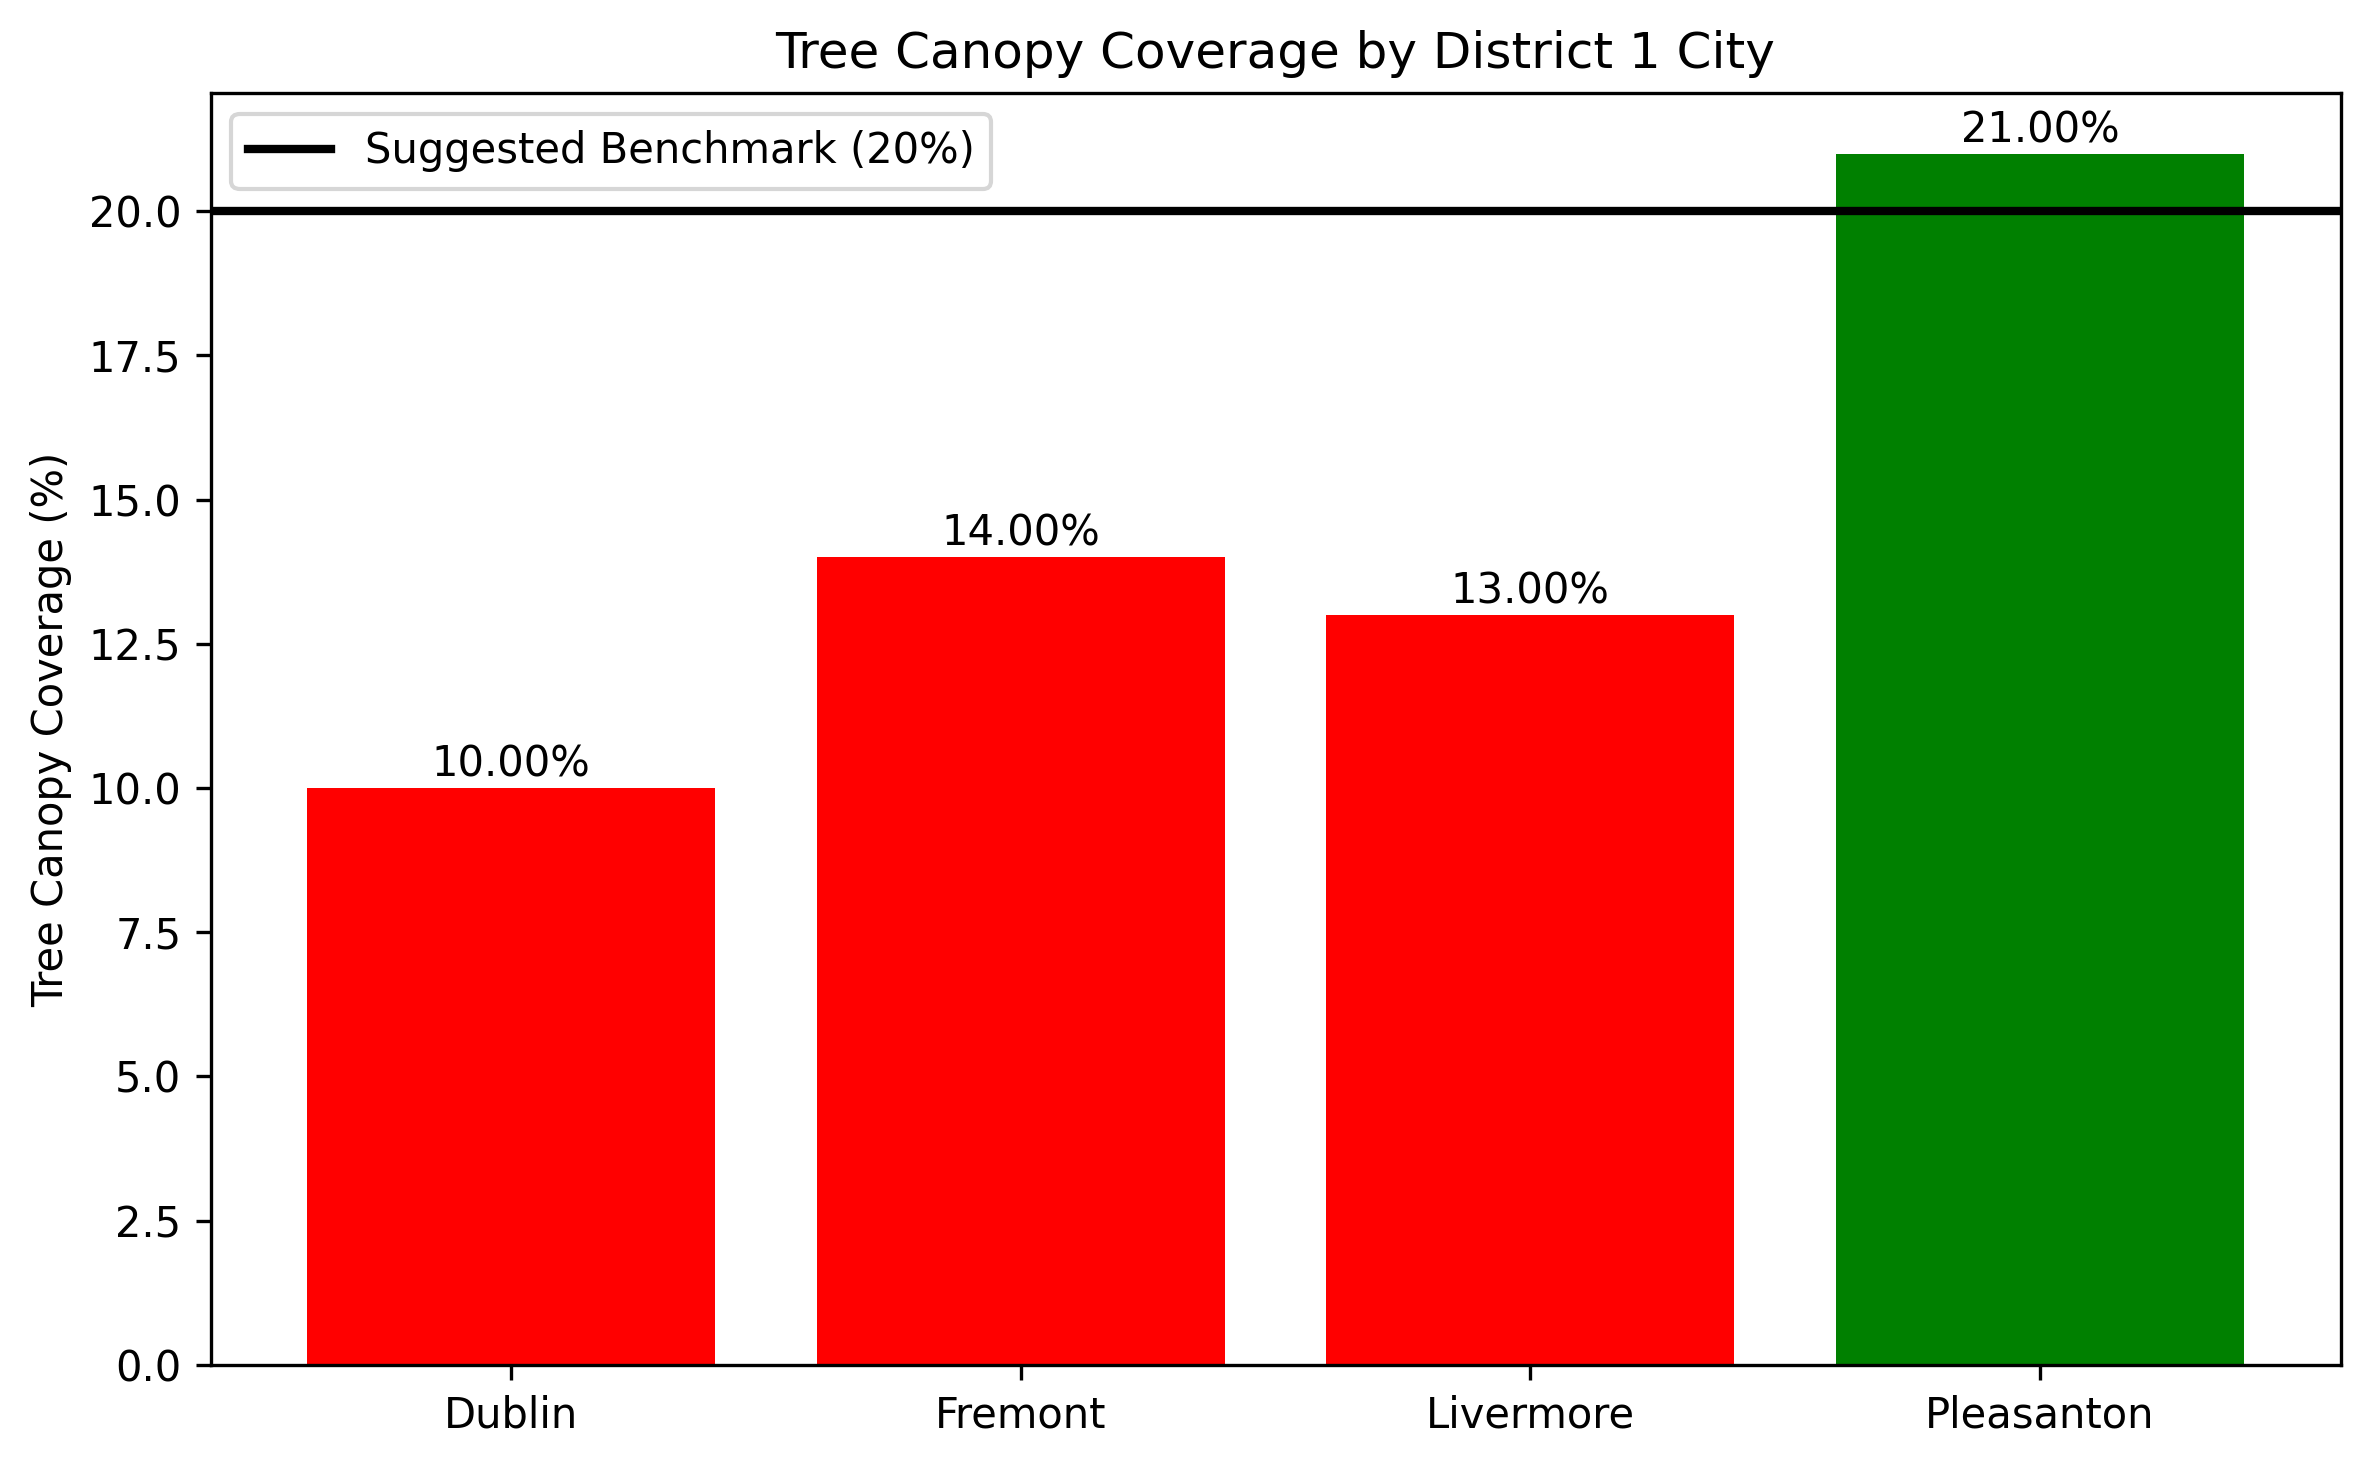
A coverage level of 20% is set as the context benchmark for grassland cities and is a realistic target; however, higher percentages could be achieved through greater investment. Pleasanton leads as the only city above the suggested grassland benchmark. The other three cities fall behind the benchmark, with Dublin falling severely behind at 10% tree canopy coverage. However, it should be noted that tree canopy coverage can also be influenced by other factors such as geography, land use patterns, and development densities.
Policy Strength
CAP Score
| City | CAP Score |
|---|---|
| Dublin | 4 |
| Dublin | 3.5 |
| Livermore | 4.5 |
| Fremont | 3.5 |
All cities scored above a 3 since they all have CAPs with specific targets in mind. Dublin scores a 4 with a live Rincon dashboard. As of its most recent update, it shows that only 1 action, switching all municipal electricity accounts to EBCE’s Renewable 100 power portfolio, has been completed, and the other 105 actions it supports are ongoing. Based on the dashboard, they are making good progress in developing an existing building electrification plan, developing an electric vehicle infrastructure plan, and adopting an electric vehicle charging station ordinance. However, they do fall short of a 5 due to no progress report and limited actions completed.
Fremont and Pleasanton both score a 3.5 but for different reasons. While Fremont does have its own Power BI dashboard on its website that focuses on climate action efforts such as trees planted and EVs registered and GHG trends, it lacks specific CAP action tracking. Pleasanton scored a 3.5 because an internal implementation tracking table exists and its strategic plan report provides partial evidence of completed CAP-related actions, but it falls short of a 4 because the tracking table is not publicly accessible and the strategic plan covers broader cities beyond climate, specifically making it difficult to directly assess CAP implementation progress.
Lastly, Livermore scores the highest with a score of 4.5 because it has a live Rincon table and an annual progress report. However, the half point comes from the dashboard showing that 88 out of the 89 actions have no action, with 1 action, which is adopting an electric reach code for new construction by 2023, being completed. In contrast, the progress report shows meaningful action such as the expansion of EV charging infrastructure through a $1.6 million California Energy Commission grant funding 100 charging ports at five city facilities, approval of 333 EV chargers across 60 permits, 4.83 MW total of rooftop solar approved, 167 heat pump permits, 253 all-electric housing units under construction, 1.42 miles of new bike lanes, 123 new trees planted, and compost distribution to over 2,200 residents. This suggests that the dashboard hasn’t been updated recently and there are tracking inconsistencies.